Worried Your Home Is Losing Value? Here's What the Inland Empire Data Actually Shows
Worried Your Home Is Losing Value? Here's What the Inland Empire Data Actually Shows
by Trena Harris
Quick Answer: National home prices are up 2.1% year over year, and headlines calling for a crash don't match the data. Locally, Riverside County's single-family median price is essentially flat over the past year but up 0.8% year to date, while San Bernardino County's median price rose 2.0% year over year with average sale price up 4.4%. Inventory dropped by double digits in both counties, which points toward tighter competition ahead, not a falling market.
Scroll through your YouTube or X feed long enough and you will find at least one doomer warning of an imminent housing crash. Some of them sound convincing too.
But the data on today's housing market tells a different story.
Home prices climbed 2.1% across the country over the past year. Below, I'm breaking down where prices are rising fastest at the state and city level, where they're falling, and what the numbers actually look like here in Riverside and San Bernardino Counties.
What's Happening to Home Prices Right Now
According to the Federal Housing Finance Agency (FHFA), home prices are up 2.1% nationally compared to a year ago. That is a little faster than the pace at the start of the year.
Prices also rose 0.3% since the first few months of this year. That slower pace suggests the market is settling into a steadier rhythm rather than swinging wildly in either direction.
Home prices have gone up every single quarter since 2012. Even with higher mortgage rates and cost pressures over the past few years, prices have kept climbing in most of the country. That fact alone should put a dent in the crash narrative.
States Where Home Prices Are Rising (or Falling) the Fastest
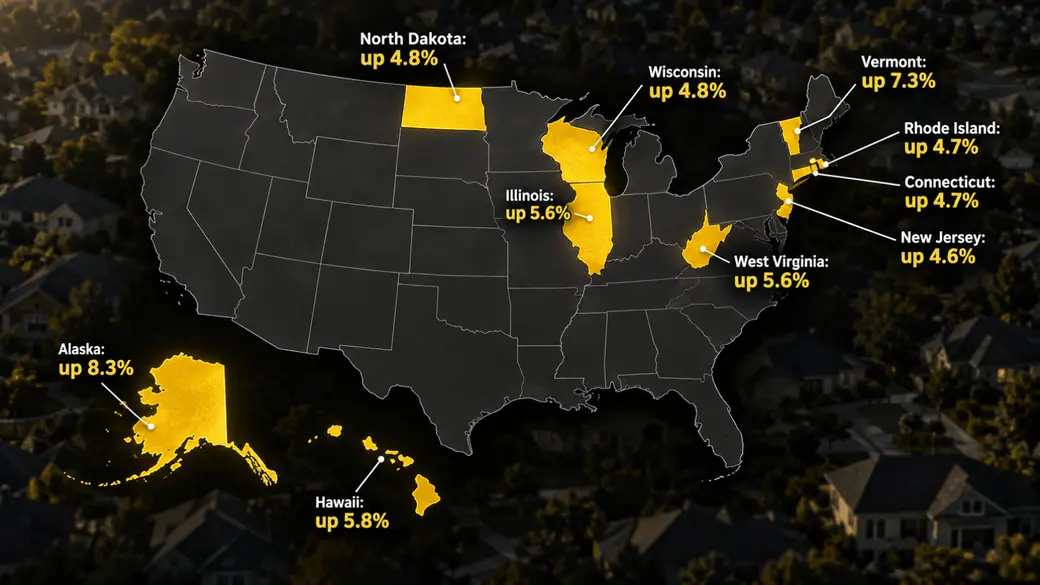
Some states are seeing much bigger gains than others. Here are the ten states with the strongest price growth over the past year:
Alaska: up 8.3%. Vermont: up 7.3%. Hawaii: up 5.8%. Illinois: up 5.6%. West Virginia: up 5.6%. Wisconsin: up 4.8%. North Dakota: up 4.8%. Connecticut: up 4.7%. Rhode Island: up 4.7%. New Jersey: up 4.6%.
Many of these states sit in the Midwest or Northeast, where there simply are not enough homes for sale to keep up with buyer demand. That imbalance keeps prices climbing.
Home prices fell in four states over the same year: New Mexico, down 1.2%. Washington, down 0.9%. Colorado, down 0.5%. California, down 0.2%.
A handful of other states, including Oregon, North Carolina, Texas, Mississippi, and Arizona, saw prices grow by less than 1% for the year. Many of these are the same markets that saw explosive growth during the pandemic and are now cooling off.
Cities Where Home Prices Are Rising (or Falling) the Fastest
City level numbers show even bigger swings than the state data. The biggest gains over the past year:
Elgin, IL up 7.7%.
Allentown-Bethlehem-Easton, PA-NJ up 7.0%.
Bridgeport-Stamford-Danbury, CT up 6.6%.
Charleston-North Charleston, SC up 6.5%.
El Paso, TX up 6.5%.
Milwaukee-Waukesha, WI up 6.1%.
Chicago-Naperville-Schaumburg, IL up 5.9%.
New York-Jersey City-White Plains, NY-NJ up 5.6%.
Newark, NJ up 5.5%.
Greensboro-High Point, NC up 5.3%.
The biggest drops over the same year:
Everett, WA down 3.7%.
San Antonio-New Braunfels, TX down 3.0%.
Bakersfield-Delano, CA down 2.6%.
Seattle-Bellevue-Kent, WA down 2.4%.
San Francisco-San Mateo-Redwood City, CA down 2.4%.
Tucson, AZ down 2.2%. Albuquerque, NM down 1.7%.
San Jose-Sunnyvale-Santa Clara, CA down 1.6%.
Washington, DC-Maryland down 1.0%.
Denver-Aurora-Centennial, CO down 1.0%.
Some cities look very different depending on the time frame you use. San Francisco's prices dropped 9.1% compared to the previous few months, even though the year over year drop was a smaller 2.4%. Short term numbers can jump around, so the year over year comparison gives a truer picture.
Why Some Markets Are Heating Up and Others Are Cooling Off
Two things are driving most of what we're seeing in this data.
Affordability. Buying a home costs more than it used to, and that is pricing some buyers out or pushing them to wait. This shows up most in expensive markets like California and parts of the Pacific Northwest, where prices already climbed a lot over the past several years.
Housing supply. In a lot of Midwest and Northeast markets, there are not enough homes for sale to meet buyer demand. When supply is tight, prices tend to hold steady or keep climbing. States like Oregon and Arizona are dealing with a different set of pressures. Prices climbed fast in those places during the pandemic, and affordability still has not caught up.
What Does This Look Like in Riverside and San Bernardino Counties?
Here is where the national headlines stop being useful and your local numbers start to matter.
Statewide, California shows a slight dip of 0.2% year over year. But that number is an average of hundreds of local markets, and it does not reflect what is actually happening on the ground here.
In Riverside County, the median sales price for single-family homes sat at $624,450 in August, essentially flat compared to a year ago. The year to date median is up 0.8% to $635,000, and homes are still selling for 99.2% of list price. Inventory dropped 19.9% from last year to 6,538 homes, and months of supply fell from 4.7 to 3.8. That is a market tightening, not weakening.
In San Bernardino County, the median sales price for single-family homes rose 2.0% year over year to $556,000, and average sales price jumped 4.4% to $629,058. Homes are selling for 99.3% of list price. Inventory dropped 14.2% to 5,737 homes, and months of supply fell to 4.8. San Bernardino County is quietly outperforming the state average while national headlines keep talking about a slowdown.
If you're selling in either county, shrinking inventory combined with steady or rising prices means you are not negotiating from a position of weakness. If you're buying, the extra negotiating room that existed a year or two ago is closing as inventory tightens in both counties.
No home price story looks exactly the same from one house to the next, even within the same zip code. Your street, your school district, and your type of home all play a role in what your home is actually worth right now.
If you're trying to figure out what your home is worth today, or whether now is the right time to make a move, let's talk. I'll walk you through exactly what's happening on your street, not just what the headlines say.
Frequently Asked Questions
Are home prices dropping in California right now? Statewide, California prices dipped slightly, about 0.2% year over year, but that number blends hundreds of local markets together. In Riverside County, single-family prices are essentially flat over the past year and up 0.8% year to date. In San Bernardino County, prices rose 2.0% year over year. Neither county reflects the mild statewide dip on its own.
Is the housing market crashing in 2026? No. National data from the FHFA shows home prices up 2.1% year over year, and prices have risen every single quarter since 2012. A slowdown in the pace of growth is not the same as a decline, and the Inland Empire data backs that up with shrinking inventory and steady to rising prices.
What is happening to home prices in Riverside County? The median sales price for single-family homes in Riverside County was $624,450 in August, nearly flat compared to a year ago. Year to date, the median is up 0.8% to $635,000, and homes are selling for 99.2% of list price. Inventory dropped 19.9% from a year ago, tightening months of supply from 4.7 to 3.8.
What is happening to home prices in San Bernardino County? The median sales price for single-family homes in San Bernardino County rose 2.0% year over year to $556,000, and the average sales price jumped 4.4% to $629,058. Inventory dropped 14.2% from a year ago, and months of supply fell to 4.8, both signs of a market that is tightening rather than cooling.
Should I wait to sell my home until prices go up more? That depends on your specific neighborhood and home type, but shrinking inventory in both Riverside and San Bernardino Counties suggests waiting could mean facing more competition rather than less once more sellers list. A local pricing analysis is the only way to know what your specific situation calls for.
Categories
Recent Posts